Creating Shape files
In the first part we discussed how to download the netcdf files containing the weather data from NOAA’s website using Python. In this part we will discuss how to create the shape files, which contains the geographic coordinates of the regions you are interested in extracting the weather data for.
Shape File
In order to extract weather data from the NETCDF files (*.nc) downloaded from NOAA’s wesbite, you need to overlay shape files with specific geo-cordinates of interest on top of the NETCDF files and extract average temperature or precipitation information for that area.
For example you need to generate a history of precipitation of a given farm in a US county, you can create a shape file in a GIS software and then use it in your python program to overlay on top of the netcdf file and extract average precipitation for that area.
How to Create Shape Files
To create shape files you need a GIS software, I will be using QGIS, which is freely available to create shape files. In this part I will list the steps needed to generate and save shape files for the area of your interest. Lets begin
Step1:- Download QGIS and Install it
You can download and install QGIS software for free from qgis.org website using the below link
https://qgis.org/en/site/forusers/download.html#
I installed it on windows and installation was fairly straightforward. Just follow the prompts
Step2:- Start QGIS desktop on your local machine and add Google Maps layer as your base layer
Now that you have QGIS open and if you are fairly new you will have a steep learning curve, I was also new to the software and I will list down the article that helped me get started on this.
Once you have the QGIS open you will need to add a google maps base layer on top of which you can create your own shape files. I followed the following tutorial to add Google maps to QGIS.
https://www.geodose.com/2018/03/how-to-add-google-maps-layer-QGIS-3.html
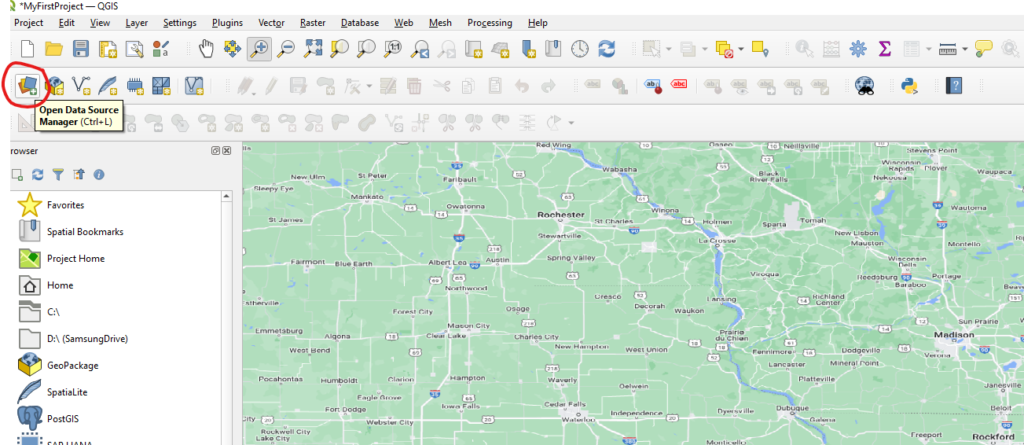
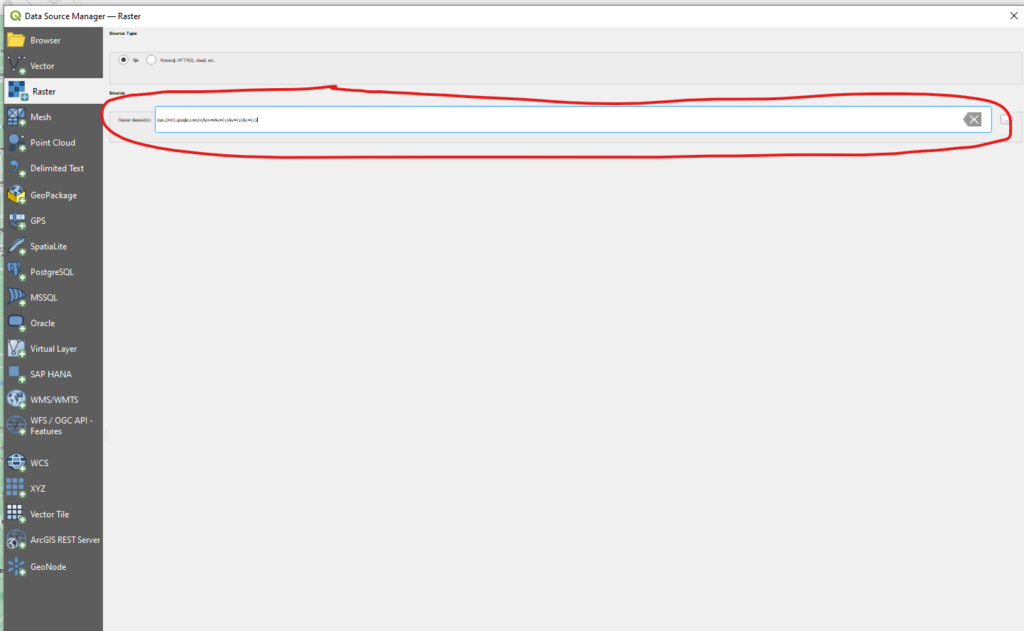
The main gist is to add a new raster source by clicking on the following button and adding the source url as mentioned below
https://mt1.google.com/vt/lyrs=r&x={x}&y={y}&z={z}


Once you have done this you will see the map in your project window and Google Maps in your layers section on the left side as shown below

Step3:- Draw your own Geo shapes over the Google maps and save them

I followed the following tutorial to create a new shape over the map and save it. You can also follow the same
https://docs.qgis.org/2.14/en/docs/training_manual/create_vector_data/create_new_vector.html
Step4:- Save the shape files and generate the following 5 files

I created the shape for a city called Dekalb in Illinois. You can create it for any region of your choice.
In the next post we will use these shape files to overlay on top of the NETCDF files from NOAA using Python and will extract precipitation and temperature information for historical dates.
Continue Reading
Please follow here for part 3
One Reply to “How to get historical weather data (min temp, max temp and precipitation) directly from NOAA (National Oceanic and Atmospheric Agency) using Python – Part 2 (Creating Shape Files)”