In part 1 and part 2, I described how to mimic and calculate metrics for photo upload process on Facebook. This is in relation to my interview prep for Facebook Data Engineering team. In this third post, I will tackle Daily and Monthly Active users metric. This is a metric which Facebook reports even on their financial statements and is very important for them. Any variation positive or negative directly impacts their bottom line, therefore we will also explore ways to analyze drop in user activity.
Before we proceed one of the book that I highly recommend to get a holistic view of modern day Data Engineering is Designing Data-Intensive Applications by Martin Kleppmann.
For people who have not read my part 1 post, please I would request to you to read it, where I describe the python process which randomly creates user sessions and follows the three step photo upload process along with some random incomplete sessions.
Welcome back to readers who have read my earlier two posts. Let’s get started with this one!
- Q1. How many Daily Active users do we have?
- Q2 . What is the ratio of Daily Active Users to Monthly Active Users i.e. Stickiness?
- Q3. How many users login the day after their first login date or what is our Day 1 retention rate?
- Q4. Analyze the factors which can cause a drop in user activity
So let’s get started answering these questions
Q1. How many Daily Active users (DAU) do we have?
Daily Active users are those unique users who use the app at least once a day, therefore any entry for a user in user_activity_log table will be called daily activity. This query is similar to the earlier question that we tackled regarding the daily unique users who post photos on facebook, but in that query we had to exclude the users whose photo upload was not completed.
Here is the query to find daily active users
--Q1. How many Daily Active users do we have?

SELECT CONVERT(VARCHAR, activity_time, 23) AS "day",
       COUNT(DISTINCT userid) as daily_active_users
FROM user_activity_log
GROUP BY CONVERT(VARCHAR, activity_time, 23)
ORDER BY 1;
So here you have daily time series of unique users, which is a very important metric to track for any app.

Another related metric is Average daily Active users for a time window (for ex a rolling window of 3 days)
This one seems easy, but requires a little more deep thought and careful understanding of the sql join because here you have to self join two tables using a between clause. Also, you need to create an intermediate table only with daily active users for each day and then use it to create a three day rolling window.
Here is the query
WITH dactu
     AS (SELECT CONVERT(VARCHAR, activity_time, 23) AS dy,
                COUNT(DISTINCT userid) AS dau
         FROM user_activity_log
         GROUP BY CONVERT(VARCHAR, activity_time, 23))
     SELECT a.dy,
            AVG(b.dau) AS "3_day_dau_avg"
     FROM dactu a
          JOIN dactu b ON b.dy BETWEEN DATEADD(day, -3, a.dy) AND a.dy
     GROUP BY a.dy
     ORDER BY 1;
And the result is below. For some days the data for last three days is not available. num_days shows how many days in the past three days the data for DAU is available.

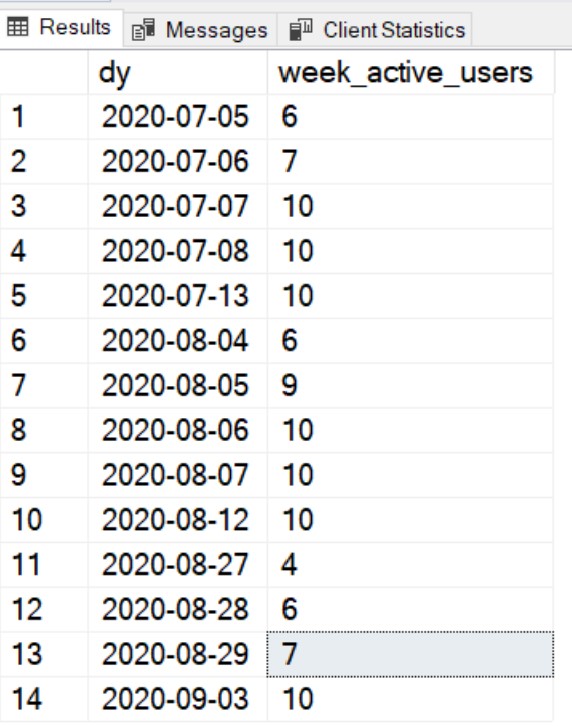
Another important metric is weekly active users. Weekly active users means unique users in a period of 1 week.
Here is the query
--Weekly active users

SELECT CONVERT(VARCHAR, a.activity_time, 23) AS dy,
       COUNT(DISTINCT b.userid)  as week_active_users
FROM user_activity_log a
     JOIN user_activity_log b ON b.activity_time BETWEEN DATEADD(day, -7, a.activity_time) AND a.activity_time
GROUP BY CONVERT(VARCHAR, a.activity_time, 23);
And the result is below

Similarly you can find monthly active users with the below query
--Monthly Active Users

SELECT CONVERT(VARCHAR, a.activity_time, 23) AS dy,
       COUNT(DISTINCT b.userid) as month_active_users
FROM user_activity_log a
     JOIN user_activity_log b ON b.activity_time BETWEEN DATEADD(day, -30, a.activity_time) AND a.activity_time
GROUP BY CONVERT(VARCHAR, a.activity_time, 23);

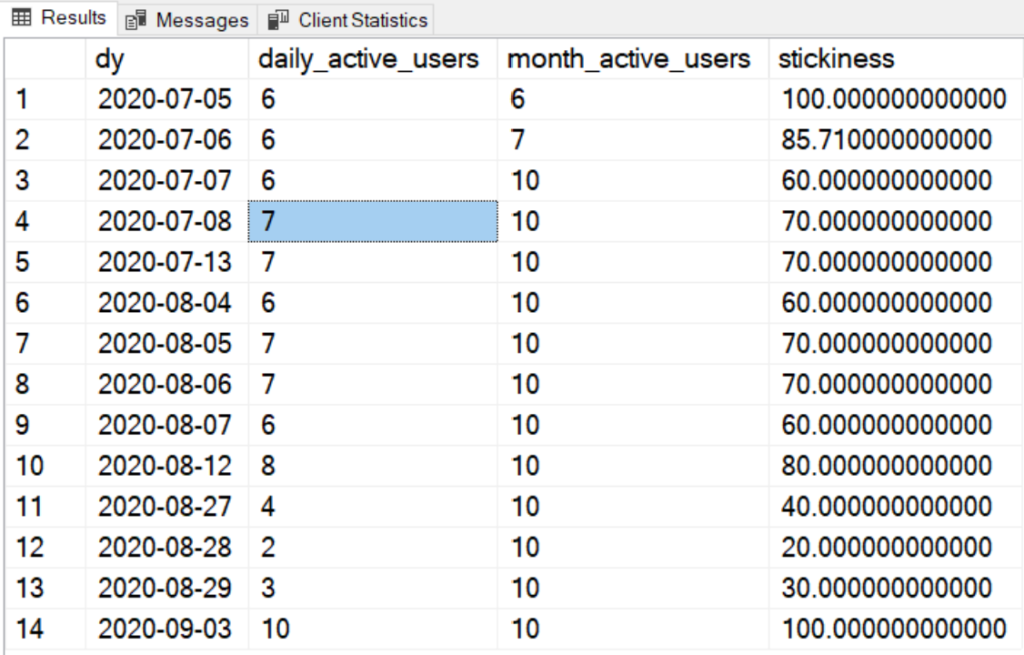
Q2 . What is the ratio of Daily Active Users to Monthly Active Users i.e. Stickiness?
Here is the query – you just need to add the daily active user count to the monthly active users query and you will have your answer.
--Q3 . What is the ratio of Daily Active Users to Monthly Active Users i.e. Stickiness?

SELECT CONVERT(VARCHAR, a.activity_time, 23) AS dy,
	   COUNT(DISTINCT a.userid) as daily_active_users,
       COUNT(DISTINCT b.userid) as month_active_users,
	   COUNT(DISTINCT a.userid)*100.0/COUNT(DISTINCT b.userid) as stickiness
FROM user_activity_log a
     JOIN user_activity_log b ON b.activity_time BETWEEN DATEADD(day, -30, a.activity_time) AND a.activity_time
GROUP BY CONVERT(VARCHAR, a.activity_time, 23);
And the result is

Q3. How many users login the day after their first login date or what is our Day 1 retention rate?
Here is the query
WITH first_login
     AS (SELECT userid,
                MIN(activity_time) AS first_login_date
         FROM user_activity_log
         GROUP BY userid)
     SELECT COUNT(DISTINCT b.userid) AS day1_retained_user_count,
            COUNT(DISTINCT a.userid) AS total_users,
			COUNT(DISTINCT b.userid)*100.0/COUNT(DISTINCT a.userid) as day1_retention_rate
     FROM user_activity_log a
          LEFT JOIN first_login b ON a.userid = b.userid
                                     AND CONVERT(VARCHAR, b.first_login_date, 23) = CONVERT(VARCHAR, DATEADD(day, -1, a.activity_time), 23);
And the result is 70%, i.e. out of the 10 users, 7 of them logged in the day after their first login.

Q4. Analyze the factors which can cause a drop in user activity
This question tests your product sense as to what reasons can you come up with to investigate a sudden drop in Daily Active Users.
Let’s think of a few scenarios why User Activity will drop suddenly.
Few reasons that come in mind are:
- There is an error in the app/web-page functionality due to recent updates
- There are network connectivity issues at certain locations
- There are changes in device operating system roll-out which has broken a functionality.
- There are upgrades in browser which has broken the functionality
- There are government level restrictions in a certain geographic area
- A competitor has launched a similar product which is taking users away
- There is a natural disaster in some area which has rendered services in accessible
- A Data center at a certain location serving the app is down
All these errors can be grouped into location, device or browser categories. A data engineer should investigate DAU for each of these categories in order to pin point the problem. This is more of an elimination exercise which will help the team reach the root cause of sudden drop in user activity
Following queries should be made to the database to investigate the issue.
- Check DAU per device
- Check DAU per location
- Check DAU per browser
Check DAU per device
SELECT CONVERT(VARCHAR, activity_time, 23),
       device_name,
       operating_system,
       COUNT(DISTINCT userid) AS DAU_per_device
FROM user_activity_log u
     JOIN devices d ON u.deviceid = d.deviceid
GROUP BY CONVERT(VARCHAR, activity_time, 23),
         d.deviceid,
         device_name,
         operating_system
ORDER BY 1;

The result gives a time series of DAU per device. A line chart with a line for each device can be used to visualize the trend.
Check DAU per location
--DAU per location

SELECT CONVERT(VARCHAR, activity_time, 23) as dy,
       ip_location as city,
       COUNT(DISTINCT userid) AS DAU_per_location
FROM user_activity_log u
GROUP BY CONVERT(VARCHAR, activity_time, 23),
         ip_location
ORDER BY 1;
In order to visualize it you might need to roll it up at country level and then state level in order to see any meaningful trends. I will return to this in my dimensional model analysis where I will create a location dimension with complete hierarchy.
Here is a part of the result of above query

Check DAU per browser
--DAU per Browser

SELECT CONVERT(VARCHAR, activity_time, 23) as dy,
       b.browser_name as browser,
	   b.browser_version as br_version,
       COUNT(DISTINCT userid) AS DAU_per_browser
FROM user_activity_log u
     JOIN browsers b ON u.browserid = b.browserid
GROUP BY CONVERT(VARCHAR, activity_time, 23),
         b.browser_name,b.browser_version
ORDER BY 1;
Here is the partial result

Again visualizing meaningfully would require a roll-op to browser categories which I will come back in the Dimension model.
Summary
I think that’s all for this 3 part series of preparing for Data Engineering onsite round. Over these three posts I have created a data model for Facebook photo_upload process, created a python script to mimic random user activity for photo upload and inserted 150 user sessions into the user_activity_log table. Along the way we have answered lots of metrics related questions that the product managers at Facebook might track. Although Facebook doesn’t ask for code to draw visualization but they do ask which type of visualization is preferred for a given metric. I will also try to produce visualizations in a separate post.
See you in my next post where I will tackle the Dimensional Model for a chosen metric
Hi buddy
Nice article, can you guide me how to prepare ? Which books are good for python or how to write python function for streaming data with huge volume.
Also I sent you one email