This is in continuation to my previous post here. By the end of the first post I had created the user_activity_log mimicry process which logged around 423 records in the log table for photo upload simulation for around 150 sessions. Do read that post before continuing on this one.
Before we proceed one of the book that I highly recommend to get a holistic view of modern day Data Engineering is Designing Data-Intensive Applications by Martin Kleppmann.
In this one we I will try to answer the metric questions I formulated in my previous post. Also listed below:-
- Q1. How many unique users post photos to Facebook each day?
- Q2. How many unique users post photos to Facebook each month?
- Q3. How much time on average (in seconds) it takes users to upload photos to Facebook?
- Q4. How much time users spend on each step on average?
- Q5. How many users failed to complete all steps?
- Q6. What are the top 2 devices used by users to post photos?
- Q7. Which browser has the fastest completion time for the photo upload process?
- Q8. At which step do most users give-up posting photos to Facebook?
- Q9. What are the top 3 location from where most users post photos to Facebook?
Before starting to answer these questions I will update some records from the user_activity_log table to July and August so that I have logs from Jul, Aug and Sep in my table. For this I will update the records using following update commands
--For July
UPDATE dbo.user_activity_log
  SET
      activity_time = DATEADD(day, -60, activity_time)
WHERE sessionid < 10;

UPDATE dbo.user_activity_log
  SET
      activity_time = DATEADD(day, -59, activity_time)
WHERE sessionid BETWEEN 11 AND 20;

UPDATE dbo.user_activity_log
  SET
      activity_time = DATEADD(day, -58, activity_time)
WHERE sessionid BETWEEN 21 AND 30;

UPDATE dbo.user_activity_log
  SET
      activity_time = DATEADD(day, -57, activity_time)
WHERE sessionid BETWEEN 31 AND 40;

UPDATE dbo.user_activity_log
  SET
      activity_time = DATEADD(day, -52, activity_time)
WHERE sessionid BETWEEN 141 AND 150;

--For Aug
UPDATE dbo.user_activity_log
  SET
      activity_time = DATEADD(day, -30, activity_time)
WHERE sessionid BETWEEN 41 AND 50;

UPDATE dbo.user_activity_log
  SET
      activity_time = DATEADD(day, -29, activity_time)
WHERE sessionid BETWEEN 51 AND 60;

UPDATE dbo.user_activity_log
  SET
      activity_time = DATEADD(day, -28, activity_time)
WHERE sessionid BETWEEN 61 AND 70;

UPDATE dbo.user_activity_log
  SET
      activity_time = DATEADD(day, -27, activity_time)
WHERE sessionid BETWEEN 71 AND 80;

UPDATE dbo.user_activity_log
  SET
      activity_time = DATEADD(day, -22, activity_time)
WHERE sessionid BETWEEN 131 AND 140;
Now I have 50 sessions each in July, August and September.
Let’s tackle the first question
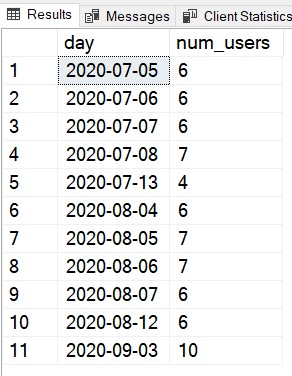
Q1. How many unique users post photos to Facebook each day?
Fairly simple query with group by, taking into account only sessions which complete step 3 of upload photo process
--Q1. How many unique users post photos to Facebook each day?

SELECT CONVERT(VARCHAR, activity_time, 23) AS "day",
       COUNT(DISTINCT userid) AS num_users
FROM dbo.user_activity_log
WHERE sessionid IN
(
    SELECT sessionid
    FROM user_activity_log
    WHERE stepid = 3
)
GROUP BY CONVERT(VARCHAR, activity_time, 23);
Next question
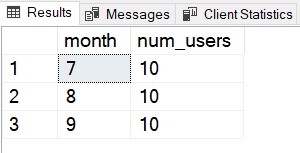
Q2. How many unique users post photos to Facebook each month?
--Q2. How many unique users post photos to Facebook each month?

SELECT MONTH(activity_time) AS "month",
       COUNT(DISTINCT userid) as num_users
FROM dbo.user_activity_log
WHERE sessionid IN
(
    SELECT sessionid
    FROM user_activity_log
    WHERE stepid = 3
)
GROUP BY MONTH(activity_time);
Q3. How much time on average (in seconds) it takes users to upload photos to Facebook?
--Q3. How much time on average(in seconds) it takes users to upload photos to Facebook?

SELECT AVG(DATEDIFF(s, a.activity_time, b.activity_time)) AS avg_upload_time_in_seconds
FROM user_activity_log a
     JOIN user_activity_log b ON a.sessionid = b.sessionid
                                 AND a.stepid = 1
                                 AND b.stepid = 3;
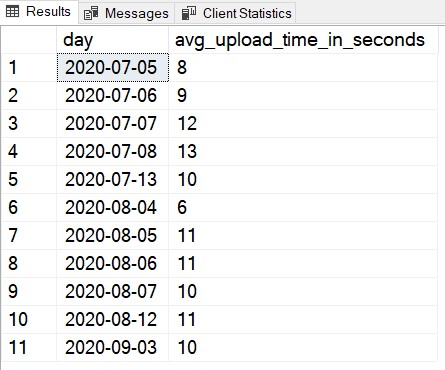
Answer is 10 seconds on average to upload a photo. This is an important metric to track per day. Below is the query to get average upload time per day. You can plot this data as a line chart to track the performance of the upload photo feature.
SELECT CONVERT(VARCHAR, a.activity_time, 23) as "day",
       AVG(DATEDIFF(s, a.activity_time, b.activity_time)) AS avg_upload_time_in_seconds
FROM user_activity_log a
     JOIN user_activity_log b ON a.sessionid = b.sessionid
                                 AND a.stepid = 1
                                 AND b.stepid = 3
GROUP BY CONVERT(VARCHAR, a.activity_time, 23);
Next question drills down into the performance of the functionality further with step wise time taken analysis
Q4. How much time users spend on each step on average?
--Q4. How much time users spend on each step on average?

SELECT a.stepid,
       AVG(DATEDIFF(s, a.activity_time, b.activity_time)) AS avg_time_on_each_step
FROM user_activity_log a
     JOIN user_activity_log b ON a.sessionid = b.sessionid
                                 AND a.stepid + 1 = b.stepid
GROUP BY a.stepid;

So answer is 5 seconds overall on each step. Now lets track this over multiple days
SELECT CONVERT(VARCHAR, a.activity_time, 23) AS "day",
       a.stepid,
       AVG(DATEDIFF(s, a.activity_time, b.activity_time)) AS avg_time_on_each_step
FROM user_activity_log a
     JOIN user_activity_log b ON a.sessionid = b.sessionid
                                 AND a.stepid + 1 = b.stepid
GROUP BY CONVERT(VARCHAR, a.activity_time, 23),
         a.stepid
ORDER BY 1,
         2;
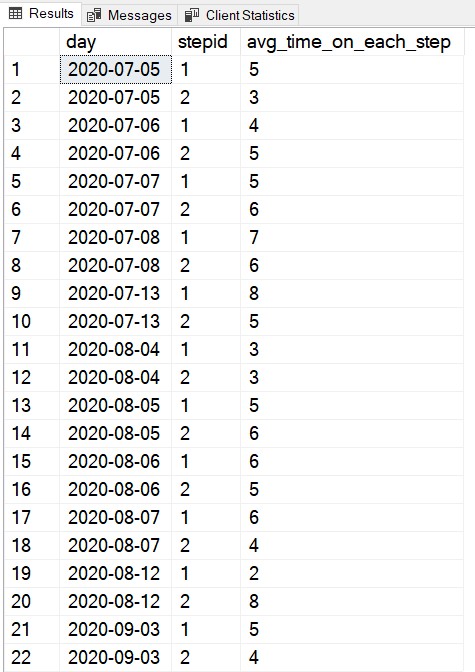
We can visualize this data using a stacked bar graph for each day.
Q5. How many users failed to complete all steps?
SELECT count(distinct userid) as unique_users, count(userid) as all_times
FROM
(
    SELECT sessionid,
           userid,
           COUNT(DISTINCT stepid) as num_steps
    FROM user_activity_log
    GROUP BY sessionid,
             userid
    HAVING COUNT(DISTINCT stepid) != 3
) a
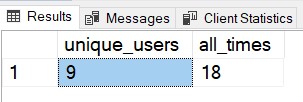
Total 9 out of 10 users experienced a incomplete photo upload process and it happened 18 times overall
Follow up question we can ask is which step experienced the most in-completion. That means out of the 3 step process users stopped most at step 1 or step 2. So here I can restrict my dataset to only sessions which were incomplete and then do a count for each step.
Here is the query to track this
--which step experienced the most in-completion
SELECT stepid,
       COUNT(*) as num_times_completed
FROM user_activity_log
WHERE sessionid NOT IN
(
    SELECT sessionid
    FROM user_activity_log
    WHERE stepid = 3
)
GROUP BY stepid;
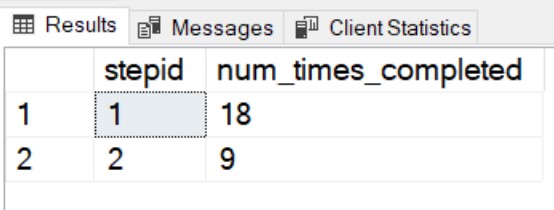
The result is below and it shows that out of 18 incomplete sessions all 18 completed step 1 but only 9 were able to complete step 2. This means there is some problem in step 2 (i.e. Select Photos). This data can be visualized by a funnel chart.
Q6. What are the top 2 devices used by users to post photos?
--Q6. What are the top 2 devices used by users to post photos?

SELECT TOP 2 d.device_name,
             d.operating_system,
             COUNT(DISTINCT sessionid)
FROM user_activity_log u
     JOIN devices d ON u.deviceid = d.deviceid
WHERE u.activty_type = 'photo_upload'
GROUP BY u.deviceid,
         d.device_name,
         d.operating_system
ORDER BY 2 DESC;
And the answer is below

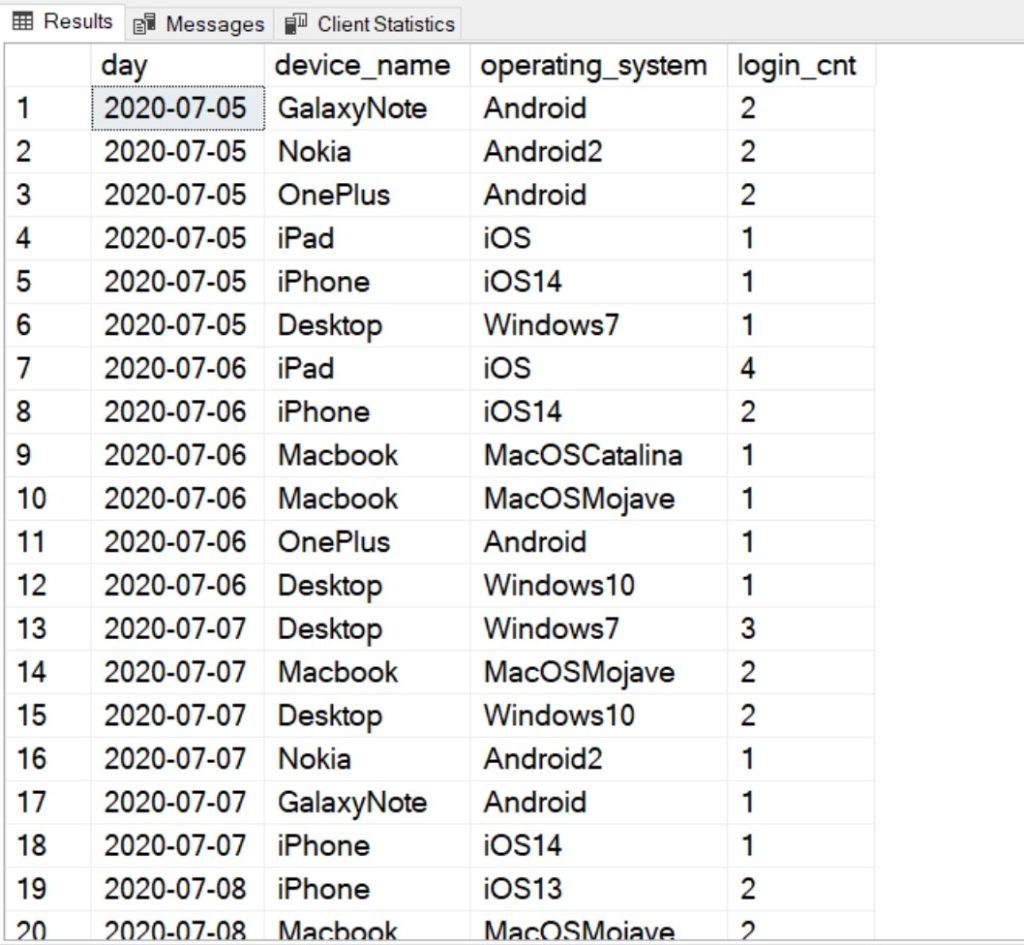
Let’s make it a bit more challenging – How many logins from each device every day?
Here is the query, but it still does not show zero counts for devices not used on that day. It might be more complex to implement. May be we can handle this in the python code which will generate the visualization
--How many logins from  each device every day?

SELECT CONVERT(VARCHAR, u.activity_time, 23) AS "day",
       d.device_name,
       d.operating_system,
       COUNT(DISTINCT u.sessionid) AS login_cnt
FROM devices d
     LEFT JOIN user_activity_log u ON d.deviceid = u.deviceid
GROUP BY CONVERT(VARCHAR, u.activity_time, 23),
         d.device_name,
         d.operating_system
ORDER BY 1,
         4 DESC;
Partial result is shown below. It is very useful in tracking device usage per day. We can extend it to include times – which user prefers which device during day time or night time? The possibilities are endless 🙂
Q7. Which browser has the fastest completion time for the photo upload process?
--Q7. Which browser has the fastest completion time for the photo upload process?

SELECT a.browserid,
       c.browser_name,
       AVG(DATEDIFF(s, a.activity_time, b.activity_time)) AS avg_upload_time_in_seconds
FROM user_activity_log a
     JOIN user_activity_log b ON a.sessionid = b.sessionid
                                 AND a.stepid = 1
                                 AND b.stepid = 3
     JOIN browsers c ON a.browserid = c.browserid
GROUP BY a.browserid,
         c.browser_name
ORDER BY 3 ASC;
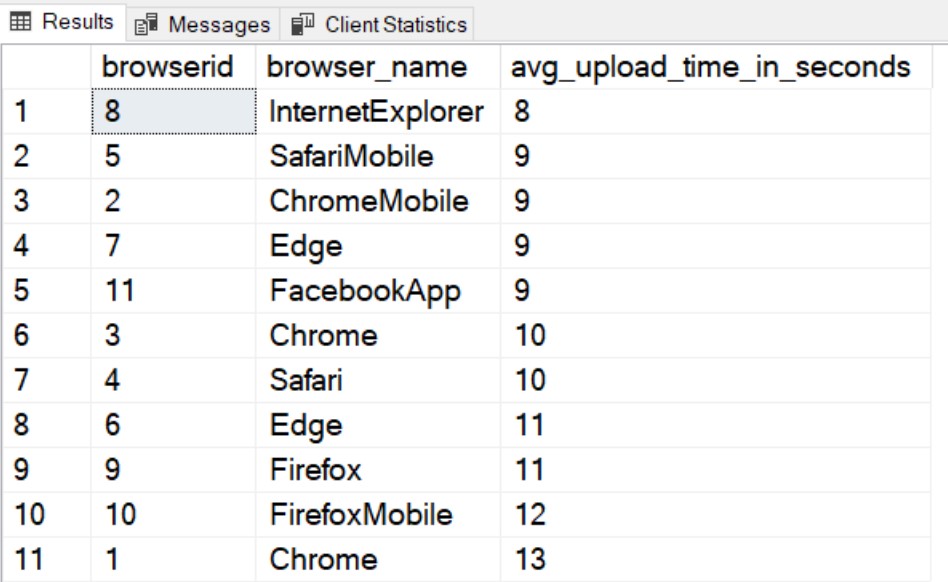
My random script has favored Internet Explorer 🙂 for some reason.
Q8. At which step do most users give-up posting photos to Facebook?
This question has been answered along with Q5 above.
Q9. What are the top 3 location from where most users post photos to Facebook?
--Q9. What are the top 3 location from where most users post photos to Facebook?

SELECT ip_location,
       COUNT(DISTINCT sessionid) AS cnt
FROM user_activity_log
WHERE sessionid IN
(
    SELECT sessionid user_activity_log
    WHERE stepid = 3
          AND activty_type = 'photo_upload'
)
GROUP BY ip_location
ORDER BY 2 DESC;
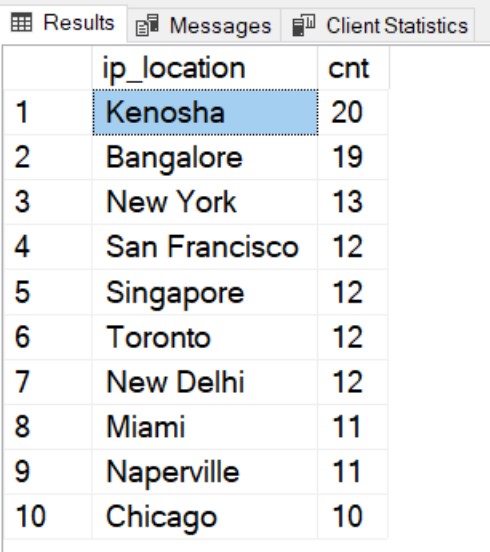
Well Kenosha is by far the most popular!
I have now answered all questions listed above. Next I will tackle questions on Daily and Monthly active users. Analyze drop in user logins. Enhance my python script to create more users, more posts and more friend requests. I will continue further in my post 3 of this series. You can find it here.
Q4. How much time users spend on each step on average?
Are we not suppose to calculate Step-3 average time also?